Search Results
100 results found with an empty search
- Cost-effective 3D modelling solutions for fabricators and architects
Knowing that you have accurate information when it comes to designing or fabricating elaborate staircases and structures is essential to save you both time and money, and give you the confidence that your staircase will fit first time. Therefore, if you need assistance with the planning and design of a new staircase, or with the renovation of an existing staircase, no matter how simple or complex, our 3D modelling and visualisation team is here to help. Above: SUMO 3D model renders of a new spiral staircase. The model enabled our client to plan, design and fabricate the necessary glass balustrades. For the construction and fabrication of new staircases, 3D-modelled renders provide you with a tool to design and plan how that staircase is going to look in a space. Alternatively, a 3D model of a staircase once in situ, or of an existing staircase that needs to be renovated, provides a clear visual tool to extract the detailed measurements needed to fabricate bespoke handrails and balustrades to exact tolerances. Above: A variety of SUMO 3D Models of staircases produced for clients. SUMO can model any shape and size of staircase, balustrades and handrails. If a staircase design is only in draft form, SUMO can 3D model the space that it will be installed in and also model the staircase from your design drawings. As a result, you can visualise your proposed staircase in the space in which it will eventually exist, making any amendments needed before fabrication, and preventing potential costly reworks. In addition, traditional, 2D drawings can prove difficult to interpret what the end result will actually look like. However, 3D models can provide your clients with a clear visualisation, allowing them to understand exactly how the finished project will look, with photographic clarity, enabling them to quickly sign off the planned designs. These visualisation packages can be presented as a real-time walk-through of the property or space, with an online password-protected login, accessible anywhere via mobile, tablet, laptop and PC. SUMO 3D model renders of a staircase in a small corner of an industrial space, from multiple views. As an example of how a 3D model can benefit you, SUMO undertook a project for a client who was designing and fabricating handrails for a staircase. They had requested a set of 2D drawings, but because of the shape and complexity of the area, we knew that a 3D model, (below), would provide them with the detail they really needed, with the benefit of costing no more than a set of 2D drawings. SUMO 3D model of a complex concrete staircase, which highlights the overhang on the stairs and the gaps in the concrete, as well as the full spiral shape of the staircase. The net result, was that the client was able to fabricate the handrails to the exact tolerances needed for this complex structure and space, without the need for costly on-site adjustments. Whatever your requirements, 3D models, renders and visualisations can be produced from 3D laser scanning data, 2D plans, or merely a concept sketch and needn’t be expensive. So don’t take the risk and contact SUMO now to order your 3D model! Want to learn more? Please pick up the phone and speak to SUMO on: 0845 456 1104
- Concrete and Structural Investigations. Issue No.19 – CSI:SUMO
It certainly no CSI:Miami, but CSI:SUMO (Concrete & Structural Investigations) gives you all the ‘concrete evidence’ you need! Utilising the latest non-invasive survey techniques, SUMO’s engineering geophysics team have a solution to help you understand more about your concrete assets. Ground Penetrating Radar (GPR), which is used predominantly in these investigations, can detect voids and delamination within the concrete, as well the thickness of the concrete slabs or walls themselves. Utilities within concrete can also be identified, along with steel elements such as beams, girders and metal plates. In addition, critical information which is required for structural assessments, such as post- tension cables and reinforced concrete bar (rebar) can also be easily mapped. Condition of Concrete structures SUMO can detect voids and delamination within the concrete. This allows for early detection of potential structural issues in a wide range of infrastructure. The example below shows evidence of voids below the floor of a dry dock. The GPR survey detected a series of voids generally occurring at the interface between the granite setts forming the top layer of the dock floor and underlying mass concrete. The void anomalies correlated with the voids identified in a programme of coring that preceded the GPR survey. Above : GPR Radargram showing voids beneath a dry dock floor at depths beween 0.75m and 1.5m Concrete reinforcement (rebar) GPR can locate and map the position and orientation of steel reinforcement and post tension cables within concrete. This information is critical during structural assessments, repairs, or modifications of existing concrete structures. Above : Rebar marked out on a concrete slab using a high frequency GPR. Data is either recorded and/or interpreted on site, depending on your requirements, including budget and timescales, to produce 3 alternative survey outputs… Mark out survey only. Mark out survey with basic reporting. Post processed survey with full reporting. Concrete Slabs GPR can measure the thickness of concrete slabs or walls accurately. This is useful in determining the structural integrity of the concrete and identifying potential areas of weakness or failure. In the example below the base of a concrete warehouse floor has been detected with GPR as a continuous, planar, horizontal high amplitude reflection. This occurred beneath the level of the rebar reflections in other scans. Post tension cables were identified in the data as discrete individual hyperbolic reflections of significantly wider diameter than rebar reflections, seen above the base of the floor. Further possible cables or structures were detected below the reflection from the base of the floor at 300mm depth. Above : GPR radargram showing the base of a concrete floor at 280mm depth, along with 3 post tension cables above the slab at 190mm depth and possible cables/structures below the slab at 300mm depth. Buried Utilities SUMO’s high frequency GPR is able to accurately locate and map underground utilities buried in concrete. This helps in avoiding accidental damage to these utilities during construction or excavation activities. Above : section view of GPR data showing a utility/service within the concrete below the rebar Most sites take no more than a day to survey and immediate initial results may be presented on-site, with more detailed post-processed results, presented in AutoCAD, available shortly afterwards to suit your timescale. Want to learn more? Please pick up the phone and speak to Simon Haddrell or Richard Fleming on 01684 592266
- A Time-Slice of History
As prize winners of The Great British SUMO Survey, SUMO undertook an exploration to provide geophysical information into a historic Cloister and Chapter House at Rochester Cathedral. Above: Rochester Cathedral, Kent. The client brief: SUMO were asked us to provide as much information as obtainable to the full extent of the Cloister and Chapterhouse, and the possible relationship with the former Roman city wall which defined the south side to the extant Cloister. The process: SUMO carried out a Ground Penetrating Radar (GPR) survey and Laser Scan survey as earlier work at the cathedral had demonstrated how effective the techniques can be in such ecclesiastical environments. The data was analysed using specialist software. In addition to manual abstraction to the radargrams, so-called ‘time slices’ were produced which reveal remains at differing depths below the surface being surveyed. The results: The GPR data fulfilled the client’s requirements and identified a complex of linear and isolated features, probably graves. The potential archaeological remains are probably associated with 11th and 12th century Chapter Houses, early Norman Cloister arrangement, 19th century Prebendal House, medieval buildings and Dormitory range. The remaining responses are modern and include potential services and evidence of tree roots. "I am delighted with the GPR survey SUMO Geophysics carried out for us at Rochester Cathedral. This can be a difficult place to work, with many complications over use, access and safeguarding. SUMO’s team were a model of professionalism throughout, which made the operational side so much easier to deal with. The results are absolutely fantastic, surpassing my most optimistic hopes for what we might achieve. I went into this project with clear aims (or at least hopes) that we might end up with a better understanding of how the medieval cloister had evolved. To find such clear evidence for a previously unknown early Norman cloister underneath the existing 12th-century one, as well as unexpected elements of the Cellarer’s Range, was a real bonus. It was also a pleasure working with the team who carried out the detailed analysis and interpretation of the survey data, which was an ideal collaboration between us. Top marks all round - thank you!" Graham Keevill, Cathedral Archaeologist - Keevill Heritage Lt Technical notes: The survey penetration depth reached approximately 2.30m - readings were taken at 0.05m intervals along each traverse set 0.08m apart. The survey was completed using a High Density Array (MALA mini MIRA) system which employs a 400MHz antenna. Two of the main advantages of radar are its ability to give information of depth as well as work through a variety of surfaces, even cluttered environments which normally prevent other geophysical techniques being used. Above: GPR data collected at Rochester Cathedral by SUMO Geophysics.
- A Drone Topographic Survey
Can you turn drone survey data into topographic drawings? SUMO Services Ltd Aerial Team can do many things with the data captured during our drone (UAS) surveys. Using a drone to capture lots of photographs over a site, we can then process them using photogrammetry software to produce Geospatial data, 3D models and many other formats for use in GIS and CAD workflows. All our surveys are georeferenced to the OS grid, via GPS and ground control points to achieve the best possible XYZ accuracy. Above: Digital Elevation Model, GIS Processed Showing Natural Topography. DEMs (Digital Elevation Models) can then be manipulated and analysed in GIS so that we can write interpretive reports, discussing the microtopography of a site and the potential for archaeological and other features. If Archaeology is suspected, SUMO can use its specialist team to scrutinise the specific area using Geophysical techniques to provide a full report of its findings. As the data is captured optically, SUMO can also produce orthomosaic mapping which can give an insight into the vegetation and how this is being affected by features beneath the ground. We can take this a step further by using multispectral sensors, to visualise the amount of chlorophyll in plants by the reflectance of bands of light not visible to the naked eye. Above: Digital Elevation Model Showing the Differing Terrain Heights. Above: GIS Interpretation Diagram showing detail captured by SUMO Services Unmanned Aerial Systems. As well as producing Geospatial outputs that can be used in many ways and for many purposes, we also generate pointclouds, with a ground sampling distance as low as 2cm - 5cm over large survey areas (100ha). The pointclouds are the same as Lidar and can be used in similar ways, but at much higher resolution and of course are bespoke to the area of interest and at a point in time relevant to the project. The pointcloud can also be exported for use in CAD and this is where our Topographic surveyors can produce traditional 2D drawings with contours and spot heights, providing a rapid understanding of a site in early planning and feasibility stages of a project. As things progress and if more detail is needed, then the initial data can be added to with surveyors on the ground to record precise positions of features not visible from the air. So we can do so much with the data captured from one drone survey, over sites large and small, to find out more do get in touch with Adam Stanford our Director of Geomatics and UAS Operations. Please pick up the phone and speak to Adam Stanford on: 01684 592266
- SUMO Engineering Solutions Issue No.20 - Geological Applications
Geology Rocks, but it still has its faults! Prior to starting a construction and infrastructure project, it can be worthwhile characterising the site’s subsurface as part of a wider geotechnical investigation, to avoid any unexpected problems and associated costs. This can include anything from the depth of drift cover to bedrock to the extent of sinkhole formation. As a first step, a non-invasive survey can therefore provide invaluable information, prior to intrusive (and expensive) site investigation works involving boreholes and sampling. SUMO’s engineering geophysics team utilise a combination of the latest survey techniques, including Ground Conductivity, Magnetic Survey, Electrical Resistivity Tomography (ERT) and Ground Penetrating Radar (GPR) to understand more about the natural features below the ground, including: Alluvial channels/paleochannels Bedrock depth Large discontinuities i.e. faults, major joints/fractures Mineralised veins Mineshafts (in mineralised areas) Sinkholes/solution features Ground Conductivity Ground conductivity surveys are well suited to some of these applications, notability sinkholes/solution features. The example below shows a solution feature in weathered chalk on the site of a former quarry. The feature has been filled from the ground above, causing the ground to collapse. Above – Photograph of a solution feature in weathered chalk. The data identified a further three anomalies potentially associated with solution features C4, C5 and C6 shown below. Above – Ground Conductivity data showing potential sinkholes - C4, C5 and C6. Anomaly C1 is likely to be related to a buried metal pipeline. The cluster of three very strong discrete anomalies C2 are associated with the rusting remnants of a scrap car abandoned on the site. C3 is a high value negative conductivity anomaly that is also likely to be associated with a buried metal feature. Magnetic Survey Magnetic Surveys are quick and cost effective, but useful tool for geological applications. Above left – Magnetic Survey data collection and right – Magnetic Survey data showing the underlying dykes and sills of the bedrock geology on a site in Cornwall. This provided a greater understanding of the complex geology of the site. Electrical Resistivity Tomography (ERT) This technique is suited to locating larger features at depth and can penetrate to depths of 20-30m. Above – A Resistivity Imaging section view showing near surface geological faults/fissures penetrating to approximately 9m depth (low resistance in blue) and bedrock (High resistance – brown and red areas) at depths between 2m and 20m. Ground Penetratng Radar (GPR) GPR has the capacity to work through a wide variety of surface materials, from soft landscaping, to hard surfaces such as tarmac and concrete. Ground Penetrating Radar is particularly adept at not only mapping buried features but approximating their depth, which provides an all-important extra level of detail. Above – A Ground Penetrating Radar (GPR) survey in progress using a dual frequency system consisting of 300MHz and 800MHz antennas. Above – A GPR Section view showing areas of granite at approximately 2m depth With a range of methodologies and techniques penetrating to depths of 30m+, SUMO has a solution to help you understand more about your site’s geology without the need for intrusive investigations. So, why not contact SUMO, before starting your next construction or infrastructure project and make sure that you take the subsurface features of your site into account at the design stage, and thereby avoid any costly surprises? Want to learn more? Please pick up the phone and speak to Simon Haddrell or Richard Fleming on 01684 592266
- The Search for Henry I's remains...
Kings and car parks ... this is becoming a habit! Back In August 2012, SUMO Goephysics assisted in the discovery of King Richard III’s remains under a car park in Leicester. It was later revealed that another English king may have a similar undignified resting place. Reading’s “Hidden Abbey Project” (HAP), instigated by Philippa Langley MBE (who also led the search for Richard III’s remains ), commissioned SUMO Geophysics to conduct a high density Ground Penetrating Radar (GPR) survey of the Abbey Quarter and the Gaol. Using cutting-edge geophysical research and complex analytical software, SUMO technicians identified a series of anomalies in the radar data. Researchers and archaeologists studied these buried anomalies which they believe related to the Abbey ruins, possible graves and other potential archaeological features and perhaps the lost remains of King Henry I. Henry I, King of England from 1100 to his death in December 1135, the youngest son of William The Conqueror, founded the Reading Abbey in 1121 intending it to be his burial place. He died, aged 67 in Normandy in December 1135 after gorging on an excess of lampreys, an eel-like fish. He was brought back for burial in January 1136. SUMO Surveyor Claire Graham said “The GPR data below the car park is very clear for an urban area, which can often be very disturbed. The features we’ve identified represent very exciting potential for further study.” Councillor Tony Page - Deputy Leader of Reading Borough Council, said: “With these tantalising initial results available, there is now much work to be done”. “This project has the potential to bring huge cultural, historical and economic benefits to the Abbey Quarter and the town as a whole and so we hope to keep the momentum going.” Credit to: The Telegraph
- The Discovery of Richard III’s Remains
Archaeologists from Leicester University confirmed that the human remains found under a council car park in Leicester were those of Richard III. The last Plantagenet King of England. History records that after being killed by Henry Tudor's army during the Battle of Bosworth in 1485, Richard III's body was buried in a nearby Franciscan friary. This friary was subsequently destroyed during Henry VIII’s reign and the exact location of the burial site remained a mystery. This was until August 2012 when member of the Richard III Society, founder of the Leicester Dig Project and Screenwriter Philippa Langley commissioned a search team to peruse the lost King's remains. The search team brought on by Philippa consisted of archaeological contractors from Leicester University (including SUMO Geophysics) and Historians from the Richard III Society, who first started their research previous to the project. It was decided the archaeological dig would commence at the car park during 2012, on the 527th anniversary of Richard's burial in Greyfriars Church. It took Philippa over three years to get the project underway and she commented "It seemed right to be starting the search for King Richard on the anniversary of the day he was buried in the Greyfriars". Richard Buckley, of the University of Leicester Archaeological Services, said at the outset: "The big question for us was in determining the whereabouts of the church on the site and also where in the church the body was buried. It was quite a long shot but it was a very exciting project. We didn’t know precisely where the body would have been buried but we suspected it would be in the choir or near the altar.’ SUMO Geophysics was tasked with completing a High Density GPR Survey. Post processing of the captured GPR data was carried out to identify areas of high activity and the results were presented in a plan format known as timeslice plots. Timeslice plots make it easy to see if areas of high activity came to form recognisable patterns. After post processing had been completed, the GPR data was compiled to create a 3D file. 3D files can be manipulated to view the data from various angles and depths within a range. Next, we linked the data to a ground level, superimposed survey grid. This was tied in with suitable topographic features around the perimeter of the site using a Total Station, to pinpoint the location of any potential anomalies and identify the areas that should be investigated further. The data collected at shallow depths (down to ~1m) showed overwhelming, strong responses which most likely associated with made ground or demolition debris. Beneath this layer, a number of anomalies such as modern services (pipes and cables) were identified. To the search teams disappointment, there were no clear signs of coherent linear anomalies that could represent the foundations of a former building. This could have been due to repeated robbing of the site over a number of years. There were however, a number of additional anomalies of potential archaeological interest, which were then specifically targeted for excavation. The targeted, ensuing dig successfully uncovered the remains of the cloisters and chapter house, as well as the church itself. Work then focused on the choir area, where it was recorded that King Richard had been interred. An adult male skeleton was subsequently found, who scientists revealed suffered from severe scoliosis (a form of spinal curvature which would have made his right shoulder appear higher than the left). The body had also suffered serious damage to the head, where a section of the back of the skull had been sliced off. There was also evidence of numerous other injuries potentially linked with death in battle. Following an array of tests including DNA testing, carbon dating and environmental analysis, the body was finally identified as Richard III and was laid to rest in March 2015 in Leicester Cathedral, closing an important chapter on England’s history. Credit : The Telegraph
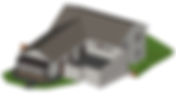
- Have You Tried a 3D SketchUp Model From SUMO?
SUMO provide Sketch-up models from laser scan point clouds or from traditional measurements. Sketch-up models can be built from old survey drawings and outputted in 2D and 3D as image files and as animations with ease and speed. Sketch-up models can be viewed in 3D by any of our clients via a free downloadable viewer. We can provide Sketch-up models built from laser scan point clouds, or from traditional measurements Sketch-up models can be built from old survey drawings Models can be output in 2D and 3D, as image files and as animations Sketch-up models can be viewed in 3D by anyone via a free downloadable viewer Sketch Up Models aren't restricted to only buildings. We were recently asked to model an Old Capstan at Devonport Dockyard.
- 5 top-tips to spot a good aerial survey service
With the use of unmanned aircraft rising in the UK, we are seeing many 'rogue' surveys being undertaken. Here at SUMO we utilise not only innovative equipment but fully qualified and experienced unmanned drone aircraft pilots such as SUMO Aerial-Cam’s Pilot Adam Stanford. As with any survey that's completed incorrectly or not to the client’s requirements, there are both significant cost and time implications. Additionally in the case of an aerial survey, it can also incur legal action due to flying in restricted air space, without the correct certification and more. SUMO's Aerial-Cam Pilot Adam Stanford has a long-standing industry reputation. Having started his career as an Archaeological photographer he soon took to the skies and hasn't looked down. His expertise sees him complete projects in even the most restricted air spaces due to his certifications. We asked Adam to give us his top tips for spotting a good survey and feeling confident in commissioning one with a survey provider: An interview with Adam Stanford, Director of Aerial-Cam Ltd. Discussing the use of UAVs/Drones for filming archaeology sites and the requirement for operators and clients to ensure work is carried out legally and with the right level of insurance. 1. Ask for their PFCO PFCO stands for permission for commercial operation and is a form of licence renewed annually by the Civil Aviation Authority (CAA). It is a legal document required by all commercial unmanned aircraft pilots in the UK. Any quality aerial survey provider will have a PFCO and don't be afraid to ask to see it and check if it's in date. You can also verify the pilot's PFCO via the CAA's website, as there is a list of permissioned operators. 2. Insurance It’s always worth asking that the operator you plan on using has the correct insurance for use of commercial UAV/Drone and that they have the appropriate level of cover: between £5m-£10m. Rogue UAV/Drone operators without PFCO are unable to obtain appropriate insurance and any level of cover would not be valid for commercial operation. As well as this, you should note that your own insurance will normally not cover UAV/Drone operations, so even if they are a volunteer doing a free survey they will still need their own appropriate level of cover. 3. Not a toy It’s extremely easy to get your hands-on UAV/ Drones nowadays. However, an easy and big mistake to make, is not asking what equipment is being used by your survey provider. A quality aerial-pilot will be using a professional aircraft which carries professional grade sensors. These professional aircraft will be fitted with appropriate fail-safe and safety features, built in - they are extremely different to toy UAV/Drones which can be purchased anywhere. 4. Experience Ideally, you should be asking if your chosen surveyor has sufficient experience to carry out the task; if they are a qualified pilot or an apprentice in training. Only fully qualified pilots can operate under a PFCO. SUMO Aerial-Cam has been operational since 2006 and has years of logged UAV/Drone flight time, as well as a deep understanding of the survey methods involved. SUMO Aerial-Cam’s Pilot Adam Stanford says that asking questions about experience is key and you shouldn't shy away from these. Any decent survey professional will be glad to answer your queries. 5. Risk Analysis Finally, always check that your operator will carry out a risk assessment and will put procedures in place to ensure risks are reduced and surveys can be carried out within the regulations set by the CAA. This may include using signage, marshals, contacting towers at nearby airfields, contacting police and councils if in urban areas and obtaining land owner permissions. Following these tips will ensure that you get the best out of your aerial survey, which can produce extraordinary results unavailable by any other method.
- Standard vs High-Density Ground Penetrating Radar (GPR) In Geophysics
Not sure of the difference between standard GPR and High-Density GPR? We asked SUMO Geophysics Directors Dr. John Gater and Simon Haddrell to discuss the differences between the techniques and how these can be applied to varying sites. What is Ground Penetrating Radar? Ground Penetrating Radar (GPR) works by pulsing electromagnetic waves into the ground, measuring the strength and time delay of the returning signal. This allows the approximate depth as well as the density of the buried object to be estimated.Typically, GPR will be used on sites ranging from highways, roads, pavements, gardens, courtyards, car parks and derelict land through to floors of churches, basements and graveyards. Building structures can also be investigated using higher frequency antennas. Are there any misconceptions about the differing techniques? Yes, we often find that because the High-Density Ground Penetrating Radar offers a range of benefits compared with standard Ground Penetrating Radar. Including improved speed, accuracy and cost. It’s often seen as 'the better of the two offerings'. However, this is usually not the case and dependent upon the target anomaly, it may not be the most suitable survey technique for your site area despite the benefits. What are the applications of Ground Penetrating Radar? The technique can be applied to a variety of sites. There are no real 'hard and fast rules'. The choice of the best equipment is ultimately determined by what the client hopes to find, as well as the size of the survey area. At SUMO we will often make this decision for the client based on our expertise and experience. In geophysics, we normally use a High-Density Ground Penetrating Radar when looking for as much detail as possible. Typically use this on sites such as a Scheduled Monument, research projects, or sites where the client expects to see multiple features such as archaeology, buried services, depth of deposits, voids or obstructions. Even stone coffins, all at once. However, in our experience, a standard GPR would also be ideal for an archaeological evaluation. In which the aim is to trace the line of a wall, or the outline of a building. Similarly, it is also ideal for a utility survey, where the aim is to trace buried utilities and find their depths. Conversely, if we are looking for very shallow features (such as rebar) or very deep features (such as culverts or Victorian drainage pipes) we would use a single channel system with an appropriate antenna. Mid-range features would see us use a High Density or Dual Frequency antenna. We research as much as we can about the site, its history and what we are looking for to aid this decision. Are there any limits to the technique? Ground Penetrating Radar can ‘see’ through a vast variety of surface materials such as tarmac, concrete, brick, stone floors and walls. On the other hand, it is of very limited use where there is a layer of clay soils. This is because the clay soils absorb most of the electromagnetic waves emitted by the equipment and distort the data. The base of the Ground Penetrating Radar equipment must be within close proximity of the ground in order to transmit the electromagnetic waves. Therefore, the smoother and clearer the survey area, the better the data. This is not to say that surveying such areas is not an option. It is simply that the equipment performs better on good site terrain. What does Ground Penetrating Radar data look like? Above: This is an example of data collected by a High-Density Ground Penetrating Radar survey over a Roman Fort. The High-Density GPR was ideal for this site and allows us to see multiple features all at once. In this case, the archaeological structures and the buried utilities. Above: This is an example of 3D data collected by a standard Ground Penetrating Radar which was ideal for this site in which the aim was to trace the outline of a Roman Villa. The data examples above are of processed data which has been collated to form the above images. The raw data is collected in Radargrams, which are a horizontal abstracts at estimated depths. See the images below to for examples of Ground Penetrating Radar 'time-slices': So, what are the big differences between each system? High-Density Ground Penetrating Radar: These systems enable fast, accurate 3D data acquisition They are built for cost-efficient (rapid) high resolution, large-area mapping ~ 0.5ha per day They are also used regularly for utility detection. As well as archaeology, concrete and forensic investigations They have multiple antennas and receivers (only 80mm apart) in one platform They can be vehicle-towed or manually pulled They are ideal for discovering mid-range features. Alternatively, different frequency antennas can be used for different applications of Standard Ground Penetrating Radar: - High frequency antennas have a high resolution. They are suitable for shallow depth of penetration and are ideal for discovering shallow features such as rebar. Low frequency antenna have a lower resolution. But they can penetrate to much deeper depths and are ideal for discovering deeper features such as culverts or Victorian drainage pipes.
- From Below the Ground Up: Combining Ground Penetrating Radar and Photogrammetry
Although the recent drought has meant that many historical sites have ‘appeared’ on the ground, as crop or parchmarks (fig.1), it has been 42 years since the last really hot summer in 1976 when this occurred - and clients can’t always wait this long to discover what is below the ground. Fortunately, with ever improving detection and mapping technologies, getting information from a site area has never been as easy or cost-effective. Two techniques which can help are Ground Penetrating Radar and UAV Photogrammetry. Above: Digital photograph of parchmarks revealing former formal garden below lawn, see online Daily Mail for more information. Firstly, what are both survey techniques? Ground Penetrating Radar: - The advent of Ground Penetrating Radar (GPR) can be traced back to as early as 1910. After years of development in radio technologies, digital signal processing (DSP) as well as breakthroughs in the software field, GPR has become a highly valuable tool for many varied applications. These include underground infrastructure and resource mapping, mine detection, archaeology & geophysics, and engineering applications. The technique works by pulsing electromagnetic waves into the ground and measuring the strength and time delay of the returning signal. This allows the approximate depth as well as the density of the buried object to be estimated. In the accompanying photograph a single time slice shows the level of detail which can be obtained from Ground Penetrating Radar. The advantage over a single digital picture (Fig. 1) is that the GPR data can ‘see’ into the ground and provide ‘pictures’ at ever increasing depths, up to about 2m on archaeological sites. Above: High density Ground Penetrating Radar Results of formal gardens by SUMO Geophysics Aerial Photogrammetry: - Photogrammetric Surveys enable rapid data capture, using specialist cameras fitted to Unmanned Aerial Vehicles (UAV's). The methodology is as old as modern photography, dating to the mid-19th century, but it is only in recent years and with the rising popularity of UAV's that this form of photogrammetry has taken to the skies. For mapping purposes, overlapping digital images are recorded which allow the survey data to be combined. In the past, where a single stereo pair of images were used, nowadays photogrammetry software can analyse oblique (both horizontally and vertically) and convergent images, as well as parallel images, and this helps minimise any systematic errors. Current software even permits the use of oblique images from flights that circle the subject, rather than flying in the more typical overlapping swaths used for aerial mapping image but distance measurements, so that height information can be recorded. Photogrammetry is used in fields such as topographic mapping, architecture, engineering, manufacturing, quality control, forensic investigation, and geological mapping. Archaeologists use it to quickly produce plans of large or complex sites, particularly on earthwork sites where features are visible above ground. See: Historic England for the Photogrammetric Applications for Cultural Heritage. Above: This is a photogrammetric model produced by SUMO Aerial-Cam of Brancaster Roman Fort, showing the raised platform of the fort in the main field and the sea marshes beyond. How are the techniques combined and what are the benefits? The techniques can be combined to overlay the individual data to obtain a better 'image' of the detected features. Superimposing Ground Penetrating Radar data onto photogrammetry is a good method of visualisising the GPR data within the ‘space’ and gives you points of reference. As well as this, the advantage of having measured height differences (from photogrammetry) is that you can make topographic corrections to the GPR data thus increasing the accuracy of the depth information - GPR software assumes that data are collected from a level surface. See below an example of GPR data superimposed onto photogrammetry. Above: Photogrammetry data by SUMO Geophysics. Above: Geophysical data and photogrammetry by SUMO Geophysics. Are there any limitations? When carrying out GPR (or any geophysical method – magnetic or electrical) and you wish to use the results with a photogrammetric image it is necessary to establish common ground control points using GPS so that the two (or more datasets) can be georeferenced and tied into the same image mapping. This is especially important if the two survey methods can’t be carried out at the same time because varying weather conditions can hinder the use of UAVs and cause increased costs. Additionally, Photogrammetric surveys must be tied into GPS fixed ordnance datum (OD) points otherwise they are floating in the air with no accurate height information.
- Tripod-Mounted Scanning vs Mobile Scanning
In the last three years, there has been an explosion in the development and variety of hardware available for collecting laser scanned pointcloud data. Scanning hardware is getting cheaper and faster. The choice range for data collection is vast and varied, depending on your needs. However, to use the most cost-effective method of data collection, clients need to engage with their surveyor and discuss what they are trying to achieve. Above: FARO Focus Lightweight tripod mounted scanners, like the FARO Focus have been the workhorse of many survey businesses. Also including mobile scanners like the more recent handheld GeoSLAM Revo. Accuracy, speed, capability and the end deliverable differentiate these two methods of data collection. These considerations should be discussed with your surveyor when deciding what approach to take. So, what are the differences? If you have commissioned a measured building survey in the last 5 years, the chances are that part or all of it has been collected by a FARO Focus tripod-mounted scanner. We own 5 of these scanners at SUMO. This type of scanner integrates easily with a control network of targets and can provide a level of accuracy equivalent to legacy 1:50 scale or +/-15mm across a building. They provide dense data which has a medium level of cleanness. The scanners also have an on-board colour camera. Newer models offer HDR imaging, though colour scanning takes additional time. Data collected this way can also be hosted on the internet and shared with our clients using FARO Webshare or Leica Truview. We expect to collect between 800 and 2,000m² in a day with this type of scanner. Mobile scanning has been around for a long time. More recently has become cheap enough for mainstream applications. What makes it unique, is the speed of data collection. This can easily reach between 6,000 and 10,000m² of floor area in just one day. SUMO collected 250,000m² of data using the handheld GeoSLAM Revo last year across the UK school estate. The speed comes at a cost in other areas. Accuracy, density and cleanness of the pointcloud is lower than tripod mounted scanning and client delivery methods like web hosting are not available. Additionally, colour photography does not integrate well with mobile data. This method offers accuracy equivalent to 1:100 scale or +/-30mm across a building compared to 1:50 scale and +/-15mm with a tripod mounted laser scanner. However, the way mobile data is registered allows collection in ways not possible with tripod mounted scanners. This includes scanning ceiling voids through individually removed ceiling tiles. Above: Example of mobile scanning data. Above: Example of tripod-mounted scanning data The two collection methods can also be used successfully together. For example, initially using mobile scanning to provide feasibility quality scan data across a whole site, followed by more detailed localised tripod mounted scanning in specific areas. Using tripod mounted scanning on the floor plate, combined with handheld scanning of ceiling voids is another example where the two methods complement each other. The key to choosing the right method is to help your surveyor understand what you are trying to achieve. This will ensure that the data collected is suitable for the work to be done with it. SUMO is always happy to discuss the right way to collect the data you need in the most cost effective manner.